Edit chart
Loading graph
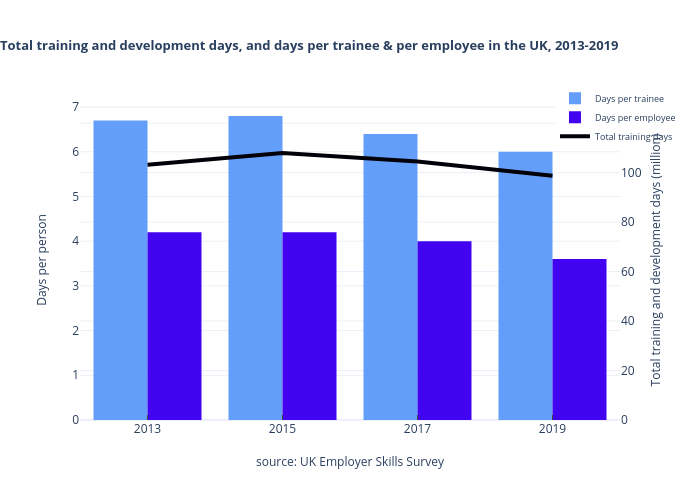
Michelezanini's interactive graph and data of "Total training and development days, and days per trainee & per employee in the UK, 2013-2019" is a grouped bar chart, showing Days per trainee, Days per employee, Total training days; with source: UK Employer Skills Survey in the x-axis and Days per person in the y-axis.. The x-axis shows values from -0.5 to 3.5. The y-axis shows values from 0 to 7.157894736842105.